India's CPI Inflation Was 6.09% in October 2026: How to Read the Release, Line by Line

On 12 November 2026, the National Statistics Office (NSO) under the Ministry of Statistics and Programme Implementation (MoSPI) released the Consumer Price Index (CPI) for October 2026. Headline inflation was 6.09%, up from 5.54% in September.
I am Nishi Jain, a full-time trader in Jaipur and ex-JioBlackRock. Most people see that one number in a news alert and move on. The release itself is only 11 pages, and it tells you a lot more: where prices rose, where they fell, and how rural and urban India compared. In this post I'll walk through it the way I read it.
This is an education post. It is not a forecast and not investment advice.
First, what CPI inflation measures
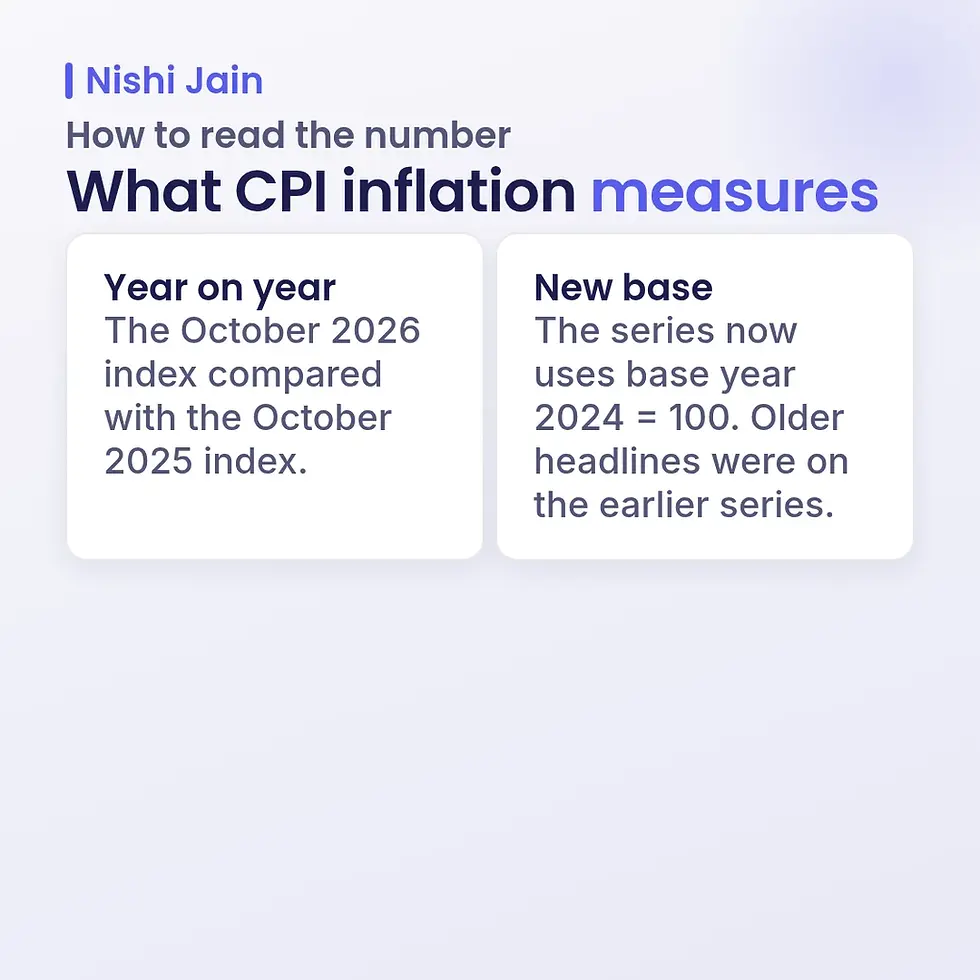
CPI tracks the retail prices of a fixed basket of goods and services that households buy. "Inflation" in the release is the year-on-year change: the October 2026 index compared with the October 2025 index.
One thing that's new this year: the series now uses base year 2024 = 100. MoSPI's own monthly table starts year-on-year inflation figures from January 2026 on this base. So when you compare October 2026 with older headlines, remember that those were on the earlier series.
The headline table
The first table in the release is the one to understand. Here it is, from page 1:
Sept 2026 (Final) | Oct 2026 (Provisional) | |
|---|---|---|
CPI inflation, rural | 6.08% | 6.63% |
CPI inflation, urban | 4.88% | 5.41% |
CPI inflation, combined | 5.54% | 6.09% |
Food inflation (CFPI), rural | 8.06% | 9.09% |
Food inflation (CFPI), urban | 7.18% | 8.68% |
Food inflation (CFPI), combined | 7.74% | 8.94% |
CPI index, combined | 109.49 | 110.05 |

Three things to notice:
"Provisional" vs "Final". October's number is provisional. It can be revised next month, when it becomes final. September's 5.54% is now final.
Rural vs urban. Rural inflation (6.63%) was more than a percentage point higher than urban (5.41%). The gap was there in September too.
CFPI is the food index. The Consumer Food Price Index is built from the food items in the CPI basket. At 8.94%, food prices rose faster than the overall basket.
How October 2026 fits the year so far

The release includes the monthly combined inflation for 2026 on the new base. Laid out in order, it shows a steady climb:
Month (2026) | Combined CPI inflation |
|---|---|
January | 2.74% |
February | 3.21% |
March | 3.40% |
April | 3.48% |
May | 3.93% |
June | 4.38% |
July | 4.45% |
August | 4.83% |
September | 5.54% |
October (provisional) | 6.09% |
So October is the highest reading so far in this series, and the first month in it above 6%.
Why 6% matters: the RBI's target band

Under the RBI Act, the government sets an inflation target for the RBI once every five years. According to the RBI, the target is 4% CPI inflation, with a lower tolerance limit of 2% and an upper limit of 6%. On 25 March 2026, the government kept the same target and band for 1 April 2026 to 31 March 2031.
That's why headlines say October "crossed the upper limit". One detail that often gets lost: the RBI page says the target counts as failed only if average inflation stays above 6% for three consecutive quarters. One month above 6% is a signal worth noticing. It is not, by that definition, a failure of the target.
What the Monetary Policy Committee does next is its decision. I'm not going to guess it here. If you want to see what households themselves expect, I wrote about RBI's November household inflation expectations survey.
Division by division: where prices rose most

Annexure I breaks the CPI into 12 divisions, each with a weight (its share of the basket). Here are the combined (rural + urban) figures for October 2026:
Division | Weight | Inflation (Oct 2026) |
|---|---|---|
Food and beverages | 36.75 | 8.51% |
Housing, water, electricity, gas and other fuels | 17.66 | 2.90% |
Transport | 8.80 | 5.84% |
Clothing and footwear | 6.38 | 4.96% |
Health | 6.10 | 2.05% |
Personal care, social protection and misc. | 5.04 | 10.14% |
Furnishings, household equipment and maintenance | 4.47 | 3.94% |
Information and communication | 3.61 | 3.16% |
Restaurants and accommodation services | 3.35 | 10.06% |
Education services | 3.33 | 4.02% |
Paan, tobacco and intoxicants | 2.99 | 4.93% |
Recreation, sport and culture | 1.52 | 2.52% |
How to read this: a division's effect on the headline depends on both its inflation and its weight. Food and beverages is more than a third of the basket, so 8.51% food-and-beverage inflation pulls the headline up much more than, say, recreation at 2.52% pulls it down. Personal care and restaurants are both above 10%, but with weights near 3-5 each.
Inside the personal care division, the group "other personal effects" shows 25.44% inflation (Annexure II). The CPI follows the UN's COICOP 2018 classification, where jewellery sits in this group, and silver jewellery was one of the five items with the highest inflation in October (see below).
The item tables: the extremes
The release lists five items with the highest and lowest inflation in October 2026 (all-India combined):
Highest inflation | Oct 2026 | Lowest inflation | Oct 2026 |
|---|---|---|---|
Onion | 116.22% | Potato | -14.24% |
Garlic | 60.74% | Cauliflower | -10.57% |
Silver jewellery | 52.39% | Coconut | -5.60% |
Ginger | 48.32% | Brinjal | -3.34% |
Lemon | 47.30% | Cabbage | -1.92% |
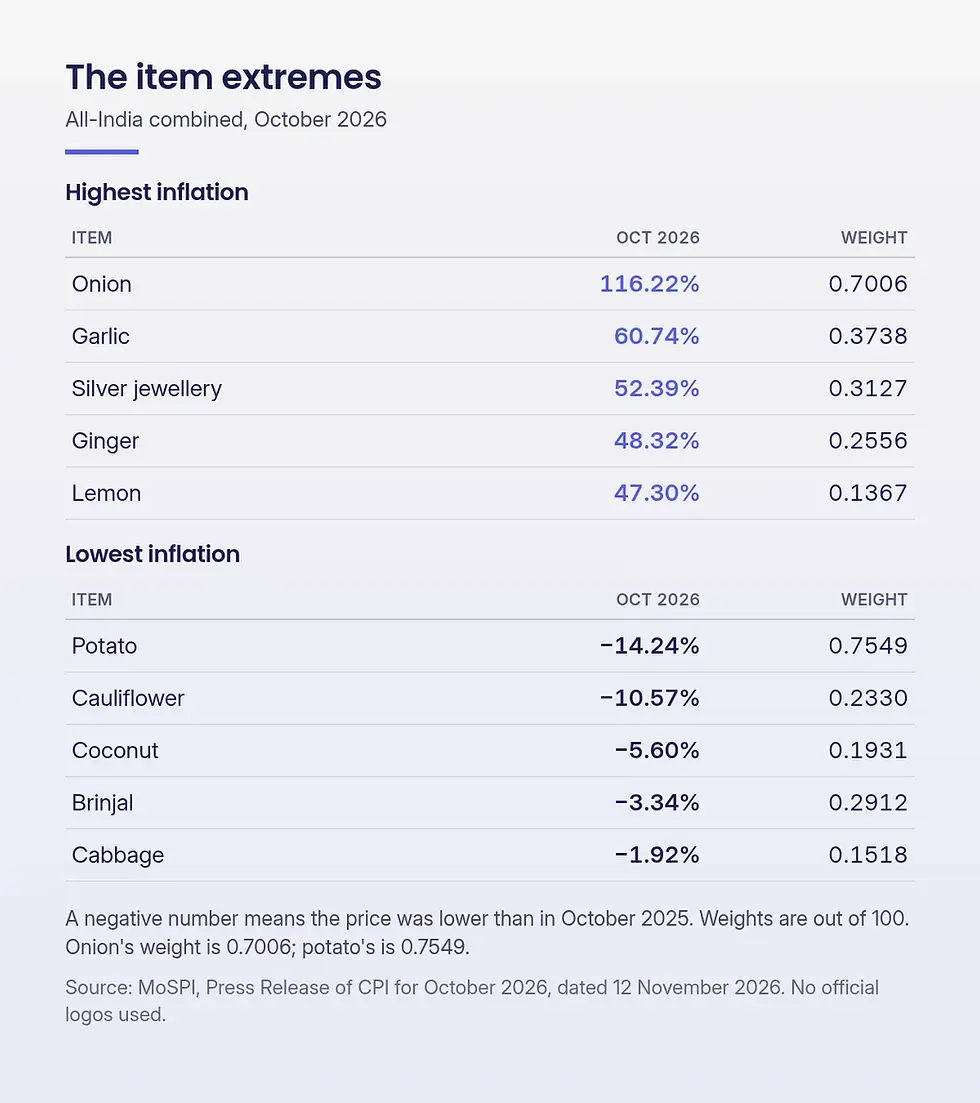
A negative number means the price was lower than in October 2025. Note how small the weights are: onion's weight is 0.7006 and potato's is 0.7549 (out of 100). Big moves in single items make headlines, but the weight decides how much they move the overall index.
States: same country, different numbers

Annexure III gives a combined inflation figure for each State/UT. A few examples from October 2026:
Tamil Nadu 7.29%, Telangana 7.26%, Andhra Pradesh 7.25%, Madhya Pradesh 7.19%, Odisha 7.17%
Rajasthan 5.89%, Maharashtra 5.85%, Gujarat 5.71%
NCT of Delhi 3.80%, West Bengal 4.66%
MoSPI itself advises caution with state-level item indices, because some are built from thin samples of price quotes.
Small notes that are easy to miss

Data collection: prices come from 1,407 urban markets (including online markets) and 1,465 villages, collected weekly. The response rate in October was 100% in both.
Fuel dates: petrol, diesel and LPG prices are taken as of the 15th of the month.
Rounding: published indices are rounded to two decimals, so if you calculate inflation yourself from them, you may get a slightly different number.
Next release: CPI for November 2026 is due on 14 December 2026 (or the next working day if the 14th is a holiday).
Why I read the release, not just the headline

I don't trade on CPI numbers, and this isn't a post about what markets will do. I read the release because it changes the context: interest-rate discussions, bank deposit and loan rates (see my note on October lending and deposit rates), and the news flow for the next few weeks all start from it. Knowing the details helps me avoid reacting to a single number in a push alert.
FAQ

What was India's CPI inflation in October 2026?
6.09% year-on-year (provisional), up from 5.54% in September 2026, according to MoSPI's release of 12 November 2026. Rural inflation was 6.63% and urban inflation 5.41%.
What was food inflation in October 2026?
Food inflation, measured by the Consumer Food Price Index (CFPI), was 8.94% (provisional), up from 7.74% in September.
What is the RBI's inflation target?
4% CPI inflation with a tolerance band of 2% to 6%. The government retained it on 25 March 2026 for the period 1 April 2026 to 31 March 2031, according to the RBI.
When is the next CPI release?
MoSPI says CPI for November 2026 will be released on 14 December 2026, or the next working day if the 14th is a holiday.
This article is for education only and is not investment advice. All figures are from MoSPI's CPI press release dated 12 November 2026 and the RBI's monetary policy overview page. Refer to the originals for full details.
— Nishi Jain, full-time trader in Jaipur, ex-JioBlackRock. Updates: https://t.me/nishijain_com.